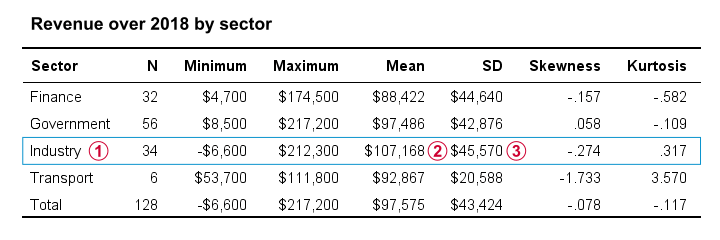
Creating nice charts and tables gives great insight into your data. They should always accompany statistical tests such as ANOVA and regression. The tutorials presented below walk you through the main scenarios. They’ll also point out which statistical test -if any- is appropriate for each case.