Summary
What’s the easiest way to obtain confidence intervals for Pearson correlations? Sadly, we couldn’t find these often requested statistics anywhere in SPSS. The best we encountered on the web were some ancient macros that, well… how to say this delicately… didn’t excel in user friendliness.
This tutorial therefore proposes a freely downloadable, menu based tool for computing one or many confidence intervals for Pearson correlations.
How to Use the Tool?
- This tool requires SPSS version 17 or higher with the SPSS Python Essentials properly installed and running. If you don’t have that available, you can use this plain syntax version instead of the actual tool.
- Download and install the Confidence Intervals for Correlations Tool. Note that this is an SPSS custom dialog.
- Navigate to
 .
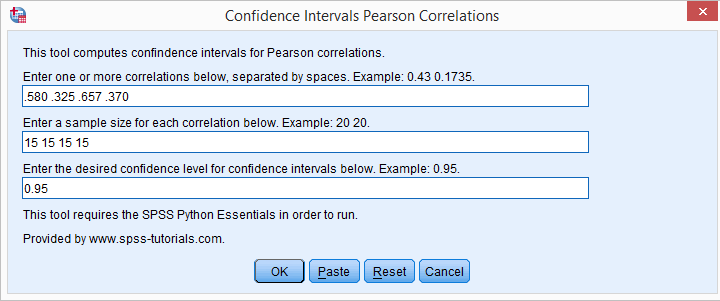
. - Fill in one or more correlations. Use your locale’s decimal separator. That’s usually a dot but some European languages use a comma. If you’re not sure: the dialog’s default confidence level uses the separator appropriate for your locale.
- Fill in the corresponding sample sizes. The number of sample sizes should be equal to the number of correlations you enter.
- Fill in a single confidence level for all correlations. Click .
- Note that clicking directs you to the online tutorial you’re currently reading.
Output
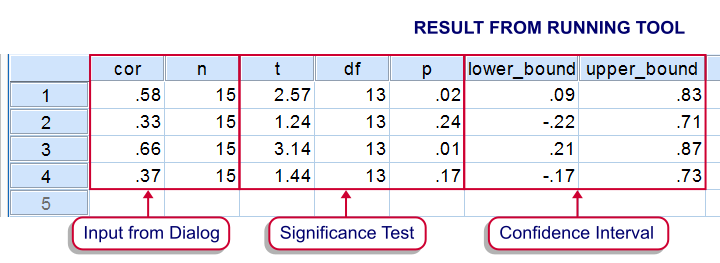
Running the tool results in SPSS creating a new dataset as shown below.
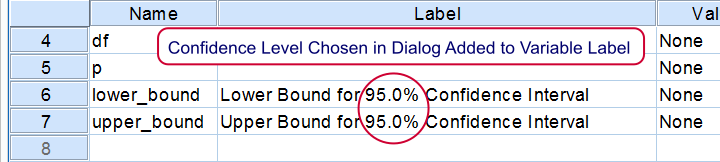
If you’re unsure which confidence level you requested, switch from data view to variable view. The confidence level is added to the variable labels of the lower and upper bounds as shown below.
Theory
The sampling distribution for a correlation approaches a normal distribution only as the sample size becomes very large. However, the result of the following non linear transformation reasonably approximates a normal distribution when n > 10:

This formula is known as Fisher’s z-transformation. After applying it, the standard normal distribution is used for computing confidence intervals for the transformed correlations.
Finally, the upper and lower bounds for the transformed correlations are converted back to “normal correlations” by reversing the aforementioned formula by means of a Newton-Raphson approximation.
We’d like to thank our colleague Reinoud Hamming from TNS NIPO for his kind assistance with the formulas.